
Before I begin, a disclaimer. VoltDB is not a customer, and did not pay Percona or me to investigate VoltDB’s scalability or publish this blog post. More disclaimers at the end. Short version: VoltDB is very scalable; it should scale to 120 partitions, 39 servers, and 1.6 million complex transactions per second at over 300 CPU cores, on the benchmarked configuration, with the recommended level of redundancy for HA.
First, if you’re new to VoltDB, I’ll summarize: it’s an open-source OLTP database that is designed to run on a cluster, not just a single machine, and doesn’t sacrifice consistency during a network partition. It is an in-memory shared-nothing system, and tables are partitioned across multiple servers in the cluster; high availability is ensured by keeping more copies of each partition. You query VoltDB with stored procedures, not with arbitrary SQL queries. It is designed to be very fast (hundreds of thousands of TPS) even on low-end machines, by doing away with the usual buffer pools, logs, latching, and so on.
The benchmark is VoltDB’s “voter” benchmark, which is explained briefly at this blog post. VoltDB’s Tim Callaghan ran the benchmark three times for each node count from 1 to 12, for k-factors of 0, 1, and 2. The k-factor is the number of redundant copies of each partition that the system maintains. An update to a partition in one server is synchronously replicated to all other copies in the cluster before the transaction completes.
Running all these benchmarks is a lot of work, which is why it is useful to run benchmarks for a dozen machines and model the behavior at larger cluster sizes. I used Neil J. Gunther’s Universal Scalability Law (USL) to model the cluster’s scalability. If you are not familiar with this model, probably the most succinct write-up is in a white paper I published some time ago. Let’s go right to the results and then I will discuss the details about the modeling.
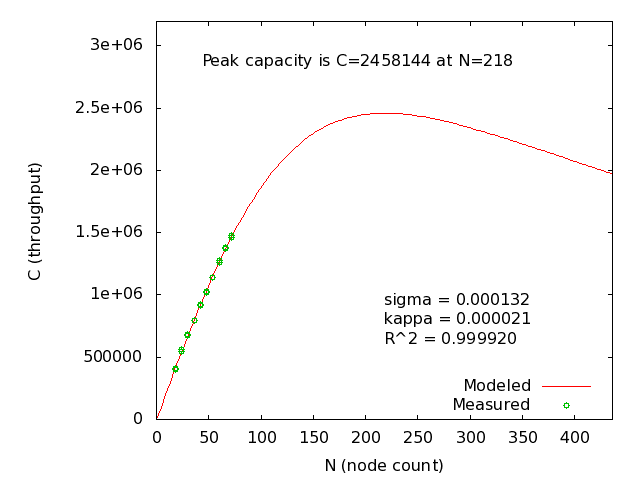
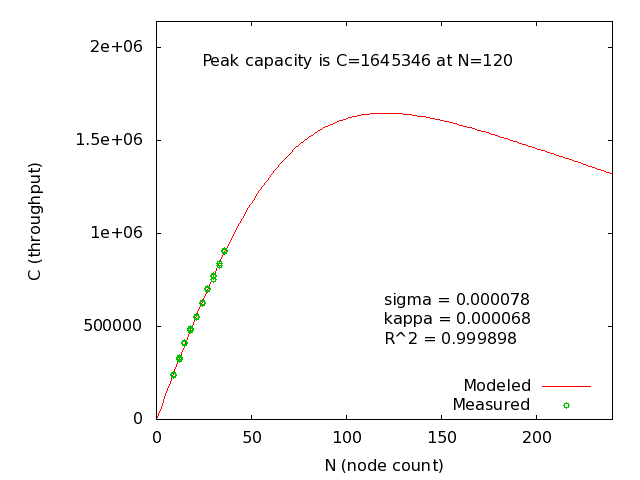
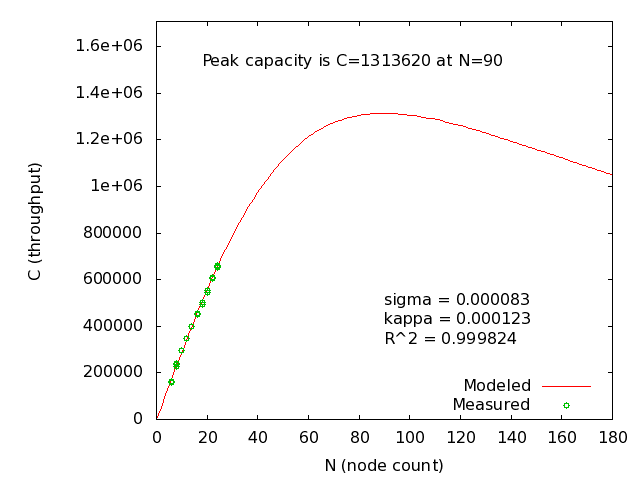
First, let’s look at results for k-factors of 0 (no redundancy), 1 (recommended), and 2 (extra safety):
 Results for k-factor 0 |  Results for k-factor 1 |  Results for k-factor 2 |
Those thumbnails are small and hard to read, but that’s OK because there is something interesting and important that’s easy to miss by looking at separate images anyway. The k-factor of 0 achieves the highest throughput, which I expected because of the lack of cross-node communication. What’s odd is that the k-factor of 0 reaches its peak throughput at 35 nodes, but k-factor 1 scales to 39 nodes and k-factor 2 doesn’t top out until 46 nodes. If we plot these on the same graph, it’s easier to see:

Actual and modeled results for k-factors 0, 1, and 2
This result was unexpected for me. I expect that a cluster with more inter-node communication should peak at fewer nodes. I asked Tim if he could explain, and he responded that it can be explained by the fact that at higher k-factors, there are fewer distinct partitions of data in the cluster. In all configurations, each node had 6 partitions of data, so when we keep more copies of the data, we have fewer unique partitions. In other words, the “unit of scaling” that is on the x-axis really shouldn’t be the server count, but rather the number of partitions in the system. I re-ran my models and generated the following graph:

Actual and modeled results with partitions for k-factors 0, 1, and 2
When approached from this angle, the results make sense. (Individual graphs by partition for k-factors: 0, 1, 2.) Now, for the recommended degree of safety, we can see that this cluster is predicted to scale to 120 partitions, at a throughput of more than 1.6 million transactions per second. This is on commodity 8-core boxes, and with 6 partitions per server and 2 copies of each partition, that should be a 40-node cluster.
In case you don’t know what to think of that, I’ll tell you: scaling a synchronously replicated, active-active master, fully ACID, always-consistent database to a 40-server cluster is impressive. Yes, it comes with some limitations (there’s a decent write-up on highscalability.com that explains more), but that is still nothing to sneeze at.
Here are some more disclaimers and details, and I’ll try to anticipate some questions:
- Percona has no plans to provide services for VoltDB. We’re focused on MySQL software and services.
- I am not a VoltDB expert. I have some understanding of VoltDB in general, and of distributed systems in general.
- This post grew out of a series of conversations and email exchanges with Tim Callaghan over the course of many months. I asked Tim lots of questions, and he ran lots of benchmarks to satisfy my curiosity.
- In the opening of this post, I say “should scale” because I don’t have access to the raw performance results from benchmarks at that scale — this is a mathematical model based on a smaller benchmark. Also note that these are not high-end servers, and VoltDB should provide even higher performance on faster machines.
- I did not audit or repeat Tim’s benchmarks in the level of detail that I would do if this were a paid engagement. However, the data fits the model very well (r-squared of 99.8% or better in all cases), and Tim didn’t know in advance that I’d be modeling the data this way, so the benchmark numbers aren’t manipulated to fit the model. The fact that they fit so well gives me a lot of confidence in them.
- I had to do a couple of things to model the benchmarks. First, I had to ignore results from one and two nodes. That’s because the inter-node communication doesn’t exist at all in a one-node cluster, and not the same way in a two-node cluster as it does at higher node counts, so the benchmark results for one and two nodes do not fit the scalability curve at all. However, the USL requires the one-node throughput as a multiplier, so I had to do a regression from higher node counts down to 1 in order to use the model. Finally, I had to adjust the computed 1-node performance slightly (ranging from 1/2 of a percent to 8 percent) to avoid unphysical parameters as a result of performing a regression against the full dataset. These are rather standard steps in applying the USL model.
- Note that the per-node and per-partition models don’t quite agree. Per-node k-factor-1 says we should scale to 39 servers, while per-partition says 120 partitions which is 40 servers. Similarly, the peak throughput numbers differ slightly. That’s because there’s some rounding, and performing a regression and USL modeling against this kind of data isn’t an exact science anyway — there is some human judgment involved (see the previous bullet point).
Let me close by answering my own question: from what I know of VoltDB it does indeed match their claim, with good scalability to dozens of servers. For more information, or to download it and try yourself, you can visit the VoltDB website.


Hi, very interesting indeed.
I want to abstract a little bit and note that probably the most important message is that ‘we’ should start thinking of (genericly speaking) data storage/retrieval, getting rid of the concept of two level of storage performance. I was thinking lately to design (yes it happens sometimes!) a hard disk drive based on DRAM after reading some posts(yours) on SSD disk, and considering that if we have a properly backed up (three levels of power in my design) DRAM drive we dont need at all SSD drives, I think DRAM does not need to be proved reliable. But the important difference is that still the ‘products’ designed with the ‘2-storage-performance’ in mind will be architecturally more complex at least. This I like of VoltDB , its a step forward, with the ‘one-only-storage’ in mind (no more single mutex contention!!!!!!)
(PS: someone already invented the drive: http://www.ddrdrive.com/ check out the performances http://www.ddrdrive.com/ddrdrive_bench.pdf)
It sounds similar in setup and philosophy to mysql cluster, with in memory data storage and hash indexes. I am actually more interested as a scale how it handles the various possible error states resulting from various kinds of networking, etc errors.
Interesting peak point. I remember I spoke at last years MySQL conference with someone working for an online gaming company who said they were running a 40 node (data nodes) MySQL Cluster. That’s the largest NDB Cluster I’ve heard of so far.
Even if NDB allows some hundred nodes in the configuration file, I was still impressed to hear about such a large cluster actually up and running and performing well. Until then we had heard of about 16-24 node clusters, even then I’m not sure if that didn’t include also MySQL nodes. I had always thought there would be a limit where the increase in inter-node communication just brings it down to a halt. But apparently 40 nodes is just fine.
And as a reminder: Just like with VoltDB, MySQL Cluster nodes form a single cluster, a single consistent database with transparent sharding.
All of this is just to say, your prediction with this theoretical model sounds realistic, who knows if it could go even beyond 40?