

After compiling Percona Server with TokuDB, of course I wanted to compare InnoDB performance vs TokuDB.
I have a particular workload I’m interested in testing – it is an insert-intensive workload (which is TokuDB’s strong suit) with some roll-up aggregation, which should produce updates in-place (I will use INSERT .. ON DUPLICATE KEY UPDATE statements for that), so it will produce all good amount of reads.
A few words about the hardware: I am going to use new the Dell PowerEdge R420 with two Intel(R) Xeon(R) CPU E5-2450 0 @ 2.10GHz, 48GB of RAM and SATA SSD: Kingston HyperX 3K 240 GB.
Workload: I will use two different schemas. The first schema is from sysbench, and the table looks like:
 CREATE TABLE sbtest$I (
 id BIGINT UNSIGNED NOT NULL,
 k INTEGER UNSIGNED DEFAULT '0' NOT NULL,
 c CHAR(120) DEFAULT '' NOT NULL,
 pad CHAR(60) DEFAULT '' NOT NULL,
 PRIMARY KEY (id)
 )
 CREATE INDEX k on sbtest$I(k)
and tables sbtest$I_r10, sbtest$I_r100, sbtest$I_r1000, with roll-up sum for 10, 100, 1000 records in the main table.
and transactions for this workload are:
1 2 3 4 5 6 7 8 9 | $ID=monotonically increasing ID $K=rand(0,10000) // distributed by pareto distribution $C, $PAD = random_string() BEGIN INSERT INTO sbtest (id, k, c, pad) VALUES ($ID, $K, $C, $PAD); INSERT INTO sbtest_r10 (id, k) VALUES ($ID/10, $K) ON DUPLICATE KEY UPDATE k=VALUES(k)+k; INSERT INTO sbtest_r100 (id, k) VALUES ($ID/100, $K) ON DUPLICATE KEY UPDATE k=VALUES(k)+k; INSERT INTO sbtest_r1000 (id, k) VALUES ($ID/1000, $K) ON DUPLICATE KEY UPDATE k=VALUES(k)+k; COMMIT; |
So this workload produces SEQUENTIAL inserts into Primary Key, that this is quite suitable for InnoDB, and in it we have random inserts into SECONDARY KEYS (k),
which is not so good for InnoDB.
So let’s see what results we have. The results are in TPS (more is better) and we start with empty tables.
Now, before looking at the graph, please do not jump to conclusions, as the graph is MISLEADING.

So we see that InnoDB performance steadily declines from 24000 tps to 18000 tps, but InnoDB can’t make 5h run. After 3h the disk is full, and InnoDB data size is about 210GB with 234.238.440 inserted records.
While TokuDB averages around 14000 tps mark with some periodical drops into 10000 tps area.
TokuDB datasize after 5h of run is about 50GB with 276.934.863 records.
So why do I say that the graph is misleading?
Obviously we can say that InnoDB is faster, but you should look into the steady decline of InnoDB throughput. Eventually it will drop to the level 14000 tps and below. I do not have enough space on this SSD to run this experiment that long. So there we see the strong side of TokuDB: it has more than 4x data compression on this dataset.
We can easily fill TokuDB tables with 1bln of rows on this SSD, and projected InnoDB performance on this size will be the same or worse, but will require 1TB in size.
Now to see this point of intersection, let’s review different workload (which actually is closer to what I need).
Tables looks like:
1 2 3 4 5 6 7 | CREATE TABLE `sbtest1` ( `hid` int(10) unsigned NOT NULL DEFAULT '0', `mid` int(10) unsigned NOT NULL DEFAULT '0', `id` bigint(20) unsigned NOT NULL, `k` int(10) unsigned NOT NULL DEFAULT '0', PRIMARY KEY (`hid`,`mid`,`id`) ) |
and transactions are:
1 2 3 4 5 6 7 8 9 10 | $HID=rand(0,10000) // distributed by uniform distribution $MID=rand(0,10000) // distributed by uniform distribution $ID=monotonically non-decreasing ID $K=rand(0,10000) // distributed by pareto distribution BEGIN INSERT INTO sbtest (hid, mid, id, k) VALUES ($HID, $MID, $ID, $K); INSERT INTO sbtest_r10 (hid, mid, id, k) VALUES ($HID, $MID, $ID/10, $K) ON DUPLICATE KEY UPDATE k=VALUES(k)+k; INSERT INTO sbtest_r100 (hid, mid, id, k) VALUES ($HID, $MID, $ID/100, $K) ON DUPLICATE KEY UPDATE k=VALUES(k)+k; INSERT INTO sbtest_r1000 (hid, mid, id, k) VALUES ($HID, $MID, $ID/1000, $K) ON DUPLICATE KEY UPDATE k=VALUES(k)+k; COMMIT; |
That is, our PRIMARY KEY is not sequential anymore, which is bad for InnoDB, but this is what I need for my setup (I still can have synthetic auto_inc PK, but in that case I still will need SECONDARY KEY (hid,mid,id) ).
Also please note the transaction produces 4 INSERTs and workload is very write intensive.
So what are results in this case:

InnoDB gradually declines as data growth (which is expected) and by the end of 5 hours averages at 2700 tps.
With TokuDB we also see a drop, and by end of 5 hours the average throughput is 7800 tps.
Something to take into account: TokuDB results are not quite stable, that is why I also show 5-minute moving averages to TokuDB.
So TokuDB shows about 2.8x better throughput, and on data size:
- InnoDB table: 58GB and 244.980.192 records
- TokuDB table: 15GB and 232.927.460 records
So TokuDB looks better in this workload, however the sparse throughput is worrisome to me. Let’s zoom in to 10 min intervals and see throughput:
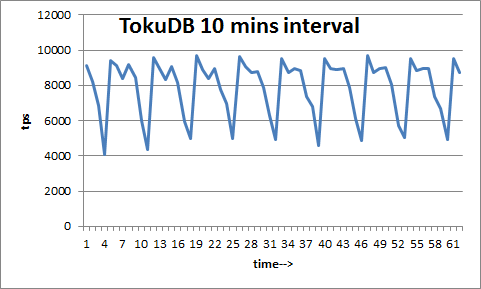
We can see periodical drops, which I believe are related to 60-sec checkpoint interval, as TokuDB does time-based checkpoints.
These drops are quite concerning, and it might be a problem for some users.
Now, I understand that my PRIMARY KEY (hid,mid,id) where id is sequential, and hid,mid is low selectivity is not good for fast inserts, but it is suitable for range selects by id. However it will interesting how both InnoDB and TokuDB performs if PK is (id,hid,mid). This also will affect select performance, so we will need to measure that also.
And, if you want to repeat this benchmark, the sysbench code is on Launchpad lp:~vadim-tk/sysbench/insert-roll-2,
command line to run:
1 | sysbench --test=insert_roll.lua --oltp-table-size=10000 --mysql-user=root --oltp-tables-count=32 --mysql_table_engine=tokudb --oltp_auto_inc=on --max-time=18000 --report-interval=10 --max-requests=0 --num-threads=32 --rand-type=pareto run |
and InnoDB options are:
1 2 3 4 5 6 7 8 9 10 11 12 13 14 15 16 17 18 19 20 21 22 23 24 25 26 27 28 29 30 31 32 33 34 35 36 37 38 39 40 41 42 43 44 45 46 47 48 49 50 51 52 53 54 55 56 57 58 59 60 61 62 | [mysqld_safe] numa-interleave malloc-lib=/usr/local/Percona-Server-5.5.30-rel30.2-500.Linux.x86_64/lib/mysql/libjemalloc.so [mysqld] gdb datadir=/mnt/data/mysql #for SSD innodb_flush_neighbor_pages = none innodb_adaptive_flushing_method = keep_average innodb_file_per_table = true innodb_data_file_path = ibdata1:100M:autoextend innodb_flush_method = O_DIRECT innodb_log_buffer_size = 256M innodb_flush_log_at_trx_commit = 1 innodb_buffer_pool_size = 36G innodb_log_file_size = 4G innodb_log_files_in_group = 2 innodb_log_block_size=4096 #####plugin options innodb_read_io_threads = 16 innodb_write_io_threads = 4 innodb_io_capacity = 4000 innodb_use_native_aio=0 #not innodb options (fixed) port = 3306 back_log = 50 max_connections = 2000 max_prepared_stmt_count=500000 max_connect_errors = 10 table_open_cache = 2048 max_allowed_packet = 16M binlog_cache_size = 16M max_heap_table_size = 64M sort_buffer_size = 4M join_buffer_size = 4M thread_cache_size = 1000 query_cache_size = 0 query_cache_type = 0 ft_min_word_len = 4 #default_table_type = InnoDB thread_stack = 192K tmp_table_size = 64M server-id = 10 #*** MyISAM Specific options key_buffer_size = 8M read_buffer_size = 1M read_rnd_buffer_size = 4M bulk_insert_buffer_size = 8M myisam_sort_buffer_size = 8M myisam_max_sort_file_size = 10G #myisam_max_extra_sort_file_size = 10G myisam_repair_threads = 1 myisam_recover socket=/var/lib/mysql/mysql.sock user=root skip-grant-tables |
TokuDB-related options are all defaults, as I understand from documentation TokuDB comes with good settings out-of-box, but I am ready to tune something if there are suggestions.


The point at 685 sec when InnoDB performance drops, is that when data doesn’t fit all in RAM anymore? I would in general expect to see benefits from TokuDB when workload is diskbound. You could artificially reduce InnoDB buffer pool (and corresponding Tokutek setting) to have more SSD vs RAM.
The main performance win of TokuDB is indexes. If you add multiple multi-column indexes the difference with InnoDB will be even more notable. Also it allows multiple clustering indexes that give additional huge win on selects.
We used TokuDB in the past (versions 3.x and 4.x). It really shines on large tables and index scan like queries.
Strikes me as odd that they actually take a previous InnoDB checkpoint benchmark from you as a reference for having outstanding checkpoint performance (eg http://www.tokutek.com/2012/04/tokudb-v6-0-frequent-checkpoints-with-no-performance-hit )
Also, which TokuDB row compressor was used? Default or lzma? If you used the default one it would be highly interesting to see the performance with lzma compression.
Michael,
I still see quite drops during checkpoints, so I think the issue is not fixed fully yet.
I used default TokuDB compression in this case.
In your my.cnf conf I don’t see barracuda file format and did you create your table using row_format = compressed with InnoDB which enables tablespace compression ?
Gregory,
I do not use compression for InnoDB.
Then why comparing ompressed tables and uncompressed table on size ? That’s clearly not relevant !
Could you redo the same test with innodb compression ?
Thanks
Gregory,
I am comparing workload that I am interested in.
I am not going to use InnoDB compression in production, as it introduces more problems than it solves.
So this comparison is relevant for me.
Vadim,
Thanks for a great performance report.
Not sure I understand why InnoDB used 210 GB for 234M rows when loaded in PK order. What am I doing wrong with my hand-wavy estimates?
234M * (200 + 20) for PK index +
234M * (12 + 7) * 1.5 for fragmented secondary index +
234M * (12 + 20) * 1.5 for fragmented sbtest_r10
I assume:
* 20 bytes for per-row metadata overhead in PK rows
* PK index pages are 15/16 full as they are loaded in order
* 7 bytes per-row metadata overhead for secondary index entries
* fragmented pages are 2/3 full
So my guess is:
* 50G for PK index
* 6G for secondary index on base table
* 11G for sbtest_r10
* much less for other rollup tables
Mark,
In this case roll-up tables are not really roll-up… I need to fix workload, and I will show numbers with real roll-up tables.
so in this case the size of roll-up table is almost the same as of main table.
The Storage part is interesting, but what about the access part. What happens when you change the ratios to include writes into the mix?
1) What concurrency did you use for the INSERT test? Don’t know if TokuDB handle concurrent workload as well as InnoDB
2) Can you also run benchmark on SELECT by PK or some range query by a secondary index? I heard that TokuDB is slower than InnoDB on SELECT but it’d be interesting to see by how much.
Hello Vadim,
TokuDB supports an upsert optimization that is applicable to your second test. Typically, the “insert on dup key update” statements do a point query to read the row. If the row exists, then the row is updated. Otherwise, the row is inserted. TokuDB has an optimization in which the point query is avoided and replaced by the injection of an upsert message into the root of the fractal tree. This can result in dramatic performance increase since the cost of reads is amortized.
TokuDB currently detected update expressions like x=x+c, where c is a constant. We could support x=x+value(x). Let me know if you would like to run this test.
Rich,
Was this upsert optimization used in Vadim’s tests? If not how do you turn this optimization on?
Andy,
I used 32 concurrent threads to insert data.
I plan benchmarks for SELECT, but it is later.
RIch,
Like I said, unfortunately upsert part did not work in this benchmark, so it was mostly INSERT benchmark.
I fixed workload and right now I am running a different test, which uses “x=x+value(x)” a lot.
So I am very interested to have it optimized and would like to run it.
Vadim, can you confirm negative scalability with InnoDB compression and multi value inserts ?
2 svar:
I can confirm that I never was able to get good results with InnoDB compression. Usually it was worse than without compression.
So far I can say that I’ve seen only one specific use case useful with InnoDB compression: i.e. you have a separate table with TEXT column, which stores data, like this comment. In this case it might be helpful to compress this table to save some storage and do not have a big performance hit.
That’s why Facebook has their own InnoDB compression, which is available in MySQL 5.6. So we may test MySQL 5.6 more to see what kind of performance it shows with compression.
A big use-case for compression is to reduce the amount of fast storage you need to buy when fast storage is expensive.
…so don’t expect it to not decrease performance but if a small loss of performance reduces your storage cost by more than half this can be a good compromise.
Mark,
So this exactly why I am looking for TokuDB.
There we see compression much better than 2x with potentially the same or even better performance.
Better compression and write-patterns that let you get longer lifetimes from lower-endurance (less expensive) flash devices — TokuDB can make a big difference
Vadim,
TokuDB does not use DirectIO with default setting. Hence, it maybe use more RAM than InnoDB in your benchmark.
Thanks Vadim,
I did the test on 5.6 and load data infile concurrently results for two threads is 20 times slower then 1 file after the other. This could not be related to primary key worth distribution, memory or CPU as repeating the same test on uncompressed table scale as expected.
Mark did you cover this case in your patches ? Add my vote on compression as we are facing more and more big data challenges where innoDB and TokuDB will have to be compare with LevelDB at some point
Vadim,
> unfortunately upsert part did not work in this benchmark, so it was mostly INSERT benchmark
What did you mean by that? In your tests you ran many INSERT .. ON DUPLICATE KEY UPDATE queries. That’s upsert, no?
TokuDB seems to work pretty well (better than InnoDB in the 2nd test) for these upsert queries. So why did you say the upsert part did not work in this benchmark?
TokuDB supports an optimization for upserts that avoids the point query in some cases. This optimization was not used in the benchmark. Since TokuDB does not currently support the VALUES update expression, the optimization was turned off. We are adding this to our code and will let you know when it is supported.
svar,
I have done some tests with concurrent load but did not see performance drops. It is reasonable that N threads doing concurrent load will be a lot slower than 1 for some N. Eventually you change from having all index blocks for all tables in memory to not and then disk read stalls occur. Not sure that was your problem or something else. PMP stacks or perf schema output might help debut it.
Mark thanks for the tip, this give me the motivation to put more efforts to explain what i saw. The same data load inside uncrompressed was good so PMP result need to follow, the only difference is the compression and range partitions. I’ll keep posting
2 Andy.
I mean that in most queries (99%) data was only inserted, not updated.
I inserted data with mostly unique PK, That is part ON DUPLICATE KEY was not triggered.
Hi Vadim,
I can confirm the steady downfall of InnoDB throughput down to ~1500 insert/sec (and counting) while TokuDB remained steadily around 20000 insert/sec.
I inserted around 100Million rows using Tokutek’s iibench.py for the benchmark on a 2-way Supermicro server with 2 Xeon X5650 @2.7GHz, 96GB of RAM and a very fast LSI MegaRaid backed storage with SSD Cache.
Aurimas worked on that machine a month ago.
Does Percona have improvements to keep the InnoDB insert buffer from getting full (as in do background reads for ibuf merges when it is getting full)? That is the key to sustaining good throughput for InnoDB on iibench.
Mark,
We do not have this improvement in Percona Server yet.
From looking at the command line options for sysbench I’m assuming you modified the source. Can I get the modified sysbench source?
Rob,
I usually use sysbench from source code on launchpad.
lp:sysbench
Vadim,
I hadn’t heard of launchpad, but I figured it out. I’m running some TokuDB vs InnoDB performance tests in a sharded environment. This should be a big help. Thanks.
I don’t know how you’re getting those kinds of TPS numbers with either database. I’m benchmarking InnoDB (XtraDB) running on Percona 5.6 and getting only 2100 TPS, and that even using sysbench in read-only mode (no inserts).
The server is a Dell PowerEdge R610, 12 x 3GHz Cores, 64GB RAM, 6 x Samsung SSD 840EVO 1TB drives (RAID 5).
Check out this non-awesomeness…
# sysbench –test=oltp –oltp-table-size=1000000 –mysql-db=test_innodb –db-driver=mysql –mysql-table-engine=innodb prepare
# sysbench –test=oltp –oltp-table-size=1000000 –max-time=60 –oltp-read-only=on –max-requests=0 –num-threads=8 –db-driver=mysql –mysql-db=test_innodb run
sysbench 0.4.12: multi-threaded system evaluation benchmark
Running the test with following options:
Number of threads: 8
Doing OLTP test.
Running mixed OLTP test
Doing read-only test
Using Special distribution (12 iterations, 1 pct of values are returned in 75 pct cases)
Using “BEGIN” for starting transactions
Using auto_inc on the id column
Threads started!
Time limit exceeded, exiting…
(last message repeated 7 times)
Done.
OLTP test statistics:
queries performed:
read: 1782676
write: 0
other: 254668
total: 2037344
transactions: 127334 (2122.15 per sec.)
deadlocks: 0 (0.00 per sec.)
read/write requests: 1782676 (29710.12 per sec.)
other operations: 254668 (4244.30 per sec.)
Test execution summary:
total time: 60.0023s
total number of events: 127334
total time taken by event execution: 479.3998
per-request statistics:
min: 1.96ms
avg: 3.76ms
max: 851.53ms
approx. 95 percentile: 4.28ms
Threads fairness:
events (avg/stddev): 15916.7500/209.42
execution time (avg/stddev): 59.9250/0.00