

Around month ago Facebook has announced the Linkbench benchmark that models the social graph OLTP workload. Sources, along with a very nice description of how to setup and run this benchmark, can be found here. We decided to run this benchmark for MySQL Server 5.5.30, 5.6.11 and Percona Server 5.5.30 and check how these servers will handle such OLTP workloads in the CPU and IO-bound cases. For this test we used a PowerEdge R720 box with a fast PCI-e flash card as storage.
By default linkbench dataset has 10M ids(after load of data size of datadir ~10GB). We used this dataset to check server behavior when data fully fits buffer pool(size of buffer pool is 30GB). So basically this is a CPU-bound case.
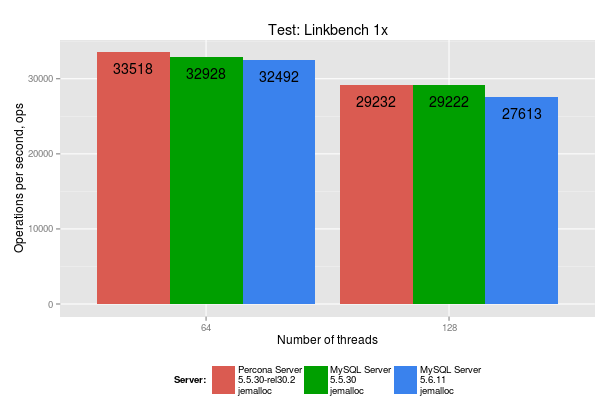
As you can see there is a very slight difference between servers at 64 threads but a much more notable drop for 5.6.11 at 128 threads.
Then we loaded 10x dataset – 100M ids (size of datadir ~100GB), size of the buffer pool is the same – 30GB. So now we explore the IO-bound scenario.
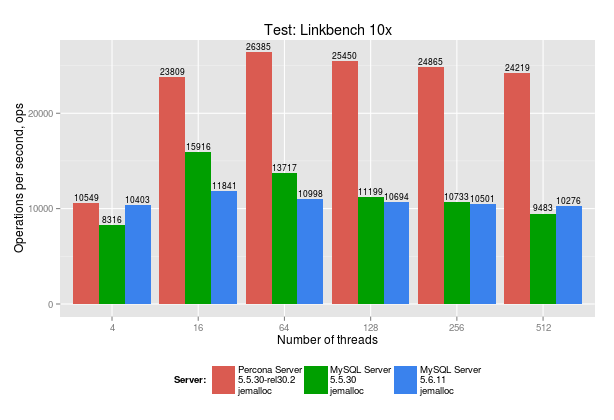
Percona Server 5.5 outperforms MySQL in about 2x times.
Both MySQL 5.5.30 and MySQL 5.6.11 demonstrate notable drops in performance. What can be the reason for that?
Below is a chart with top mutexes for each server at 64 threads:
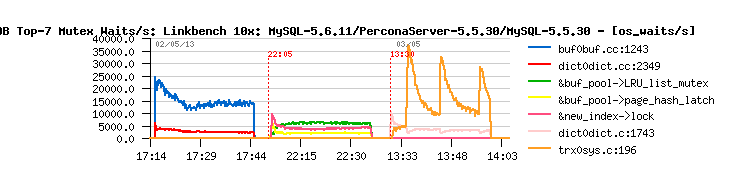
For MySQL 5.5.30 top mutex is &doublewrite->mutex: trx0sys.c:196. And most likely this symptom is related to BUG#67808.
For MySQL 5.6.11 top mutexes is &buf_pool->mutex,&new_index->lock. I profiled 5.6.11 in this IO bound scenario with the perf – see profile below:
1 2 3 4 5 6 7 8 9 10 11 12 13 14 15 16 17 18 19 20 21 22 23 | # Overhead Samples Command Shared Object # ........ .......... ....... ................... .................................................................................................................................. # 35.85% 17738833 mysqld mysqld [.] buf_LRU_free_block(buf_page_t*, unsigned long) | --- buf_LRU_free_block(buf_page_t*, unsigned long) | |--99.94%-- buf_LRU_scan_and_free_block(buf_pool_t*, unsigned long) | buf_LRU_get_free_block(buf_pool_t*) | | | |--94.84%-- buf_page_init_for_read(dberr_t*, unsigned long, unsigned long, unsigned long, unsigned long, long, unsigned long) ... 31.41% 15534570 mysqld mysqld [.] rw_lock_x_lock_func(rw_lock_t*, unsigned long, char const*, unsigned long) | --- rw_lock_x_lock_func(rw_lock_t*, unsigned long, char const*, unsigned long) | |--99.14%-- buf_LRU_free_block(buf_page_t*, unsigned long) | | | |--100.00%-- buf_LRU_scan_and_free_block(buf_pool_t*, unsigned long) | | buf_LRU_get_free_block(buf_pool_t*) 2.53% 1338484 mysqld mysqld [.] ut_delay(unsigned long) |
So basically most of the time 5.6.11 spent in LRU_scan. I tried to increase innodb_lru_scan_depth variable to 8k,16k,32k but that had no notably impact on result. In the best possible combination I got ~15k operations per second for MySQL 5.6.11.
Conclusion:
In CPU-bounds case MySQL performs quite well, though we can see small performance drop in MySQL 5.6.
In IO-bound cases MySQL still has performance issues around mutexes and Percona Server shows much better results
Configurations and how to run benchmark:
 [mysqld]
 user=root
 port=3306
innodb_buffer_pool_size = 30G
innodb_flush_method = O_DIRECT
innodb_log_file_size = 2000M
innodb_log_files_in_group = 2
innodb_flush_log_at_trx_commit = 1
innodb_log_buffer_size=128M
innodb_max_dirty_pages_pct=80
innodb_file_format=barracuda
innodb_file_per_table
innodb_read_io_threads = 8
innodb_write_io_threads = 8
innodb_io_capacity = 5000
sync_binlog=0
max_connections=5000
table_open_cache=5000
table-definition-cache=1000
query_cache_size=0
query_cache_type=0
performance_schema=0
#56only
loose-innodb_flush_neighbors=0
loose-metadata_locks_hash_instances=256
innodb_buffer_pool_instances=16 # MySQL 5.5 and 5.6
loose-innodb_io_capacity_max = 15000
#Percona only
 innodb_adaptive_hash_index_partitions=8
 innodb_buffer_pool_instances=1
 innodb_adaptive_flushing_method=keep_average
 innodb_flush_neighbor_pages=none
1 2 3 4 5 | command line to load 10x dataset: ./bin/linkbench -D dbid=linkdb -D host=127.0.0.1 -D user=root -D port=3306 -D password= -D maxid1=100000001 -c config/MyConfig.properties -l command line to run test for 10x dataset: ./bin/linkbench -D requesters=64 -D dbid=linkdb -D host=127.0.0.1 -D user=root -D port=3306 -D password= -D maxid1=100000001 -c config/MyConfig.properties -csvstats final-stats.csv -csvstream streaming-stats.csv -D requests=5000000 -D maxtime=1800 -r |


For 5.6 you need to set innodb_lru_scan_depth to a value similar to innodb_io_capacity. They should have made LRU page flushing a function of innodb_io_capacity, but they didn’t and a lot of people are going to waste time and lose performance because of this. I am one of those people.
When MySQL 5.6 spends a lot of time in buf_LRU_scan_and_free_block you are not going to have good performance results. Prior to 5.6 foreground threads were responsible for moving pages to the free list via buf_flush_free_margin. I did a lot of work for the innodb_fast_free_list option to fix the stalls and that change makes 5.1 competitive with 5.6 (http://mysqlha.blogspot.com/2013/02/mysql-56-is-much-faster-on-io-bound.html) but that patch can’t be used in 5.6.
In 5.6 a background thread, buf_flush_page_cleaner_thread, should be moving all pages to the free list. Foreground threads can still do it, but the server is much less efficient when they must do it. And when they call buf_LRU_scan_and_free_block they are trying to do it.
I filed a few bugs for this and I hope most of them will be fixed in 5.6.12. They should make a difference. I think Oracle might be aware of some of these problems prior to my bug reports — but it is hard to know what goes on behind the large wall between us and them.
http://bugs.mysql.com/bug.php?id=68658
http://bugs.mysql.com/bug.php?id=68588
http://bugs.mysql.com/bug.php?id=68555
http://bugs.mysql.com/bug.php?id=68481
I am not sure this one will be fixed. Too bad, as Percona has a fix for it – http://bugs.mysql.com/bug.php?id=45892
Thanks for sharing this!
seems like I have a new headache now.. ;-))
stay tuned..
Rgds,
-Dimitri
Agreed, thanks for sharing. I hope to be running this on TokuDB soon.
One more bug that explains why LRU page flushing rate is much less than innodb_lru_scan_depth even if innodb_lru_scan_depth is large enough. Apparently fixed in 5.6.12 — http://bugs.mysql.com/bug.php?id=69170
This got stuck behind “awaiting moderation”. Normally my comments here don’t get stuck like that. Wonder if “too many URLs” is the spam signal but URLs for bugs.mysql.com really aren’t spam.
For 5.6 you need to set innodb_lru_scan_depth to a value similar to innodb_io_capacity. They should have made LRU page flushing a function of innodb_io_capacity, but they didn’t and a lot of people are going to waste time and lose performance because of this. I am one of those people.
When MySQL 5.6 spends a lot of time in buf_LRU_scan_and_free_block you are not going to have good performance results. Prior to 5.6 foreground threads were responsible for moving pages to the free list via buf_flush_free_margin. I did a lot of work for the innodb_fast_free_list option to fix the stalls and that change makes 5.1 competitive with 5.6 (http://mysqlha.blogspot.com/2013/02/mysql-56-is-much-faster-on-io-bound.html) but that patch can’t be used in 5.6.
In 5.6 a background thread, buf_flush_page_cleaner_thread, should be moving all pages to the free list. Foreground threads can still do it, but the server is much less efficient when they must do it. And when they call buf_LRU_scan_and_free_block they are trying to do it.
I filed a few bugs for this and I hope most of them will be fixed in 5.6.12. They should make a difference. I think Oracle might be aware of some of these problems prior to my bug reports — but it is hard to know what goes on behind the large wall between us and them.
http://bugs.mysql.com/bug.php?id=68658
http://bugs.mysql.com/bug.php?id=68588
http://bugs.mysql.com/bug.php?id=68555
http://bugs.mysql.com/bug.php?id=68481
I am not sure this one will be fixed. Too bad, as Percona has a fix for it – http://bugs.mysql.com/bug.php?id=45892
Is it just coincidence that the observed ops rate in 5.6 is about the same as the loose-innodb_io_capacity_max setting? It’s not imposing some kind of limit is it? Just wondering…
innodb_io_capacity is a somewhat hard limit on flushing from the flush list. see also innodb_io_capacity_max
innodb_lru_capacity is a hard limit on flushing from the LRU
These are the max per second per buffer pool instance. Prior to 5.6 InnoDB did “furious flushing” when needed and the rates would be exceeded when there was work to do. See also http://mysqlha.blogspot.com/2013/05/configuring-innodb-for-mysql-56.html
I have a working hypothesis why buf_LRU_free_block() is so expensive. The way buf_LRU_scan_and_free_block() is written right now we’ll call buf_LRU_free_block() on each block as we scan from the tail of the LRU. This function returns false if the block is not ready for eviction. But before it returns false, it computes the fold value and based on that it acquires the page_hash lock. All this is unnecessary if the block is not replaceable. We need to check that by calling buf_flush_ready_for_replace() and only call buf_LRU_free_block() if buf_flush_ready_for_replace() returns true.
I also tried LinkBench with 5.6 a little.
Though I have not identified the actual bug# yet,
the problem you mentioned seems to be already fixed at current revision.
Please looking forward to the next (or 2nd next) release.
Thank you.
(10x data 30G BP 600sec measure after (maybe) enough warmup; PCI-e flash)
threads ops/sec
64 around 8000
16 around 8000
4 around 5000
mysql-5.6.11 (wo doublewrite)
64 around 13000
16 around 12000
4 around 6000
—
mysql-5.6-dev (doublewrite)
64 around 16000
16 around 12000
4 around 5500
mysql-5.6-dev (wo doublewrite)
64 around 20000
16 around 14000
4 around 6000
These result numbers might not be so accurate.
But should not has so much error (such as 2x times :-))
* I added these settings for this workload-hardware
innodb_io_capacity = 20000
innodb_io_capacity_max = 100000
innodb_read_ahead_threshold = 0
innodb_change_buffer_max_size = 1
innodb_lru_scan_depth = 2000
Yasufumi – it is very nice to hear from you. Linkbench can also be a good test to find performance stalls from the index lock. I think the published version of linkbench partitions the link table. Remove that and the index lock limits performance for IO-bound workloads.
I am also looking for to the next few releases. I filed several bugs for cases where page flushing wasn’t going as fast as desired — either from the flush list or the LRU. The potential for 5.6 is there, we just need a few more things fixed and the fixes at this point don’t require major changes. So I am hoping that 5.6.12 or 5.6.13 will be really good for my tests.
Mark – Linkbench seems have performance stalls itself. So the results are unstable and inaccurate for me. It often wastes 100% of cpu and nothing to do for mysqld, and it continues in several 10 seconds for each 1-2 minutes. The warmup time is also necessary for Linkbench itself?(even though not needed for InnoDB) How long? 600 sec seems not enough when 64 requesters.
Yasufumi – I will try to debug this. Can you provide thread stacks from the Java process when the problem occurs?
Yasufumi – I didn’t not explore the amount of warmup time needed for an IO-bound setup.
Mark – It was ParallelGC. “-XX:+UseConcMarkSweepGC -Xms1000m -Xmx1000m” seems to make stable.
Some PCI-e flash card (e.g. FusionIO’s) driver seems to use main memory as data cache as much as possible. If the free memory is large as buffer pool, it might not practical result as IO-bound case as intended. The throughput might depend on main memory size stronger rather than buffer pool size. We should pay attention also for main memory size of the server.
I used maxid1=1B for my tests. That might be 100X given the terminology used in this blog post. Databases were several hundred GB on disk.
The unstable result problem I met (e.g. 32G BP was faster than 50GB BP even I used O_DIRECT when I tested) might not be from PCI-e flash card (cached etc..). But it might be from LinkBench. The LinkBench (at least I used at the time) seems strongly depend on GC of java VM at the high throughput. The room of memory (10~20GB for 100 sessions?) might be needed for high LinkBench throughput. I think LinkBench should have less dependency for GC to test on fast storage, reusing objects/sessions/stmt more or something… Otherwise, we might not confirm the problem and fix correctly…
Hello Alex,
When you say 64 threads/128 threads, how/where are you setting this number? Is this a mysql setting or is this a linkbench setting?
I am running some benchmarks on R620 with Fusion IO storage. I am setting the requestors=200 in linkbench config. Will be sharing my results soon
Thanks
Ratheesh
Also, How are you measuring the operations/Sec? Is this the output from linkbench?
I can see linkbench printing this to stdout:
INFO 2013-07-12 15:19:21,709 [Thread-14]: 79160000/100000000 requests finished: 79.2% complete at 5216.1 ops/sec 15176.2/100000 secs elapsed: 15.2% of time limit used
INFO 2013-07-12 15:19:21,867 [Thread-15]: 79170000/100000000 requests finished: 79.2% complete at 5216.7 ops/sec 15176.4/100000 secs elapsed: 15.2% of time limit used
INFO 2013-07-12 15:19:23,593 [Thread-104]: 79180000/100000000 requests finished: 79.2% complete at 5216.7 ops/sec 15178.1/100000 secs elapsed: 15.2% of time limit used
INFO 2013-07-12 15:19:39,928 [Thread-96]: Requester #96 394773/500000 requests done
I can also see linkbench printing this at the very end of its benchmark run:
INFO 2013-07-12 06:38:40,595 [main]: REQUEST PHASE COMPLETED. 100000000 requests done in 31098 seconds. Requests/second = 3215
I am seeing a much much better performance in Percona 5.1.59 compared to 5.5.30.
My linkbench benchmark is run on a Dell R620 with Fusion IO.
Here are the details of the benchmark:
1) 100G data
2) Data on fusion IO
3) 200 requester threads
4) Percona 5.1 version I used is 5.1.59 and Percona 5.5 version is 5.5.30
5) Following innodb (xtradb) settings used:
innodb_log_file_size = 256M
innodb_read_ahead=0
innodb_read_io_threads=8
innodb_write_io_threads=16
# innodb_adaptive_flushing_method=keep_average (Percona 5.1)
innodb_adaptive_checkpoint=keep_average (Percona 5.5)
innodb_flush_method=O_DIRECT
innodb_io_capacity=10000
innodb_flush_neighbor_pages=0
And here is the result from the benchmark runs:
Percona 5.1
——————-
INFO 2013-07-15 15:18:34,746 [main]: ADD_NODE count = 2572626 p25 = [0.2,0.3]ms p50 = [0.4,0.5]ms p75 = [6,7]ms p95 = [47,48]ms p99 = [100,200]ms max = 32010.212ms mean = 9.902ms
INFO 2013-07-15 15:18:34,746 [main]: UPDATE_NODE count = 7369998 p25 = [0.1,0.2]ms p50 = [0.6,0.7]ms p75 = [11,12]ms p95 = [41,42]ms p99 = [82,83]ms max = 17554.31ms mean = 9.017ms
INFO 2013-07-15 15:18:34,746 [main]: DELETE_NODE count = 1011615 p25 = [0.1,0.2]ms p50 = [0.5,0.6]ms p75 = [10,11]ms p95 = [40,41]ms p99 = [81,82]ms max = 16071.228ms mean = 8.779ms
INFO 2013-07-15 15:18:34,747 [main]: GET_NODE count = 12930594 p25 = [0.1,0.2]ms p50 = [0.4,0.5]ms p75 = [10,11]ms p95 = [39,40]ms p99 = [77,78]ms max = 1473.839ms mean = 8.234ms
INFO 2013-07-15 15:18:34,747 [main]: ADD_LINK count = 8988232 p25 = [6,7]ms p50 = [19,20]ms p75 = [40,41]ms p95 = [100,200]ms p99 = [100,200]ms max = 39697.423ms mean = 33.311ms
INFO 2013-07-15 15:18:34,747 [main]: DELETE_LINK count = 2990456 p25 = [3,4]ms p50 = [15,16]ms p75 = [37,38]ms p95 = [99,100]ms p99 = [100,200]ms max = 40041.858ms mean = 29.526ms
INFO 2013-07-15 15:18:34,747 [main]: UPDATE_LINK count = 8009832 p25 = [5,6]ms p50 = [20,21]ms p75 = [42,43]ms p95 = [100,200]ms p99 = [100,200]ms max = 40237.835ms mean = 34.915ms
INFO 2013-07-15 15:18:34,747 [main]: COUNT_LINK count = 4886431 p25 = [0.2,0.3]ms p50 = [4,5]ms p75 = [13,14]ms p95 = [36,37]ms p99 = [74,75]ms max = 1549.128ms mean = 9.839ms
INFO 2013-07-15 15:18:34,747 [main]: MULTIGET_LINK count = 526856 p25 = [0.3,0.4]ms p50 = [3,4]ms p75 = [13,14]ms p95 = [34,35]ms p99 = [69,70]ms max = 1631.487ms mean = 9.507ms
INFO 2013-07-15 15:18:34,748 [main]: GET_LINKS_LIST count = 50713360 p25 = [1,2]ms p50 = [12,13]ms p75 = [30,31]ms p95 = [76,77]ms p99 = [100,200]ms max = 3398.476ms mean = 21.978ms
INFO 2013-07-15 15:18:34,751 [main]: REQUEST PHASE COMPLETED. 100000000 requests done in 10325 seconds. Requests/second = 9684
Percona 5.5
——————
INFO 2013-07-11 18:38:14,142 [main]: ADD_NODE count = 2574456 p25 = [0.6,0.7]ms p50 = [2,3]ms p75 = [5,6]ms p95 = [19,20]ms p99 = [100,200]ms max = 21389.093ms mean = 19.426ms
INFO 2013-07-11 18:38:14,142 [main]: UPDATE_NODE count = 7370348 p25 = [0.4,0.5]ms p50 = [1,2]ms p75 = [4,5]ms p95 = [100,200]ms p99 = [200,300]ms max = 21350.648ms mean = 18.9ms
INFO 2013-07-11 18:38:14,142 [main]: DELETE_NODE count = 1012354 p25 = [0.4,0.5]ms p50 = [1,2]ms p75 = [4,5]ms p95 = [100,200]ms p99 = [200,300]ms max = 20648.562ms mean = 18.603ms
INFO 2013-07-11 18:38:14,143 [main]: GET_NODE count = 12941470 p25 = [0.2,0.3]ms p50 = [0.4,0.5]ms p75 = [2,3]ms p95 = [100,200]ms p99 = [200,300]ms max = 1237.913ms mean = 17.22ms
INFO 2013-07-11 18:38:14,143 [main]: ADD_LINK count = 8988233 p25 = [5,6]ms p50 = [12,13]ms p75 = [100,200]ms p95 = [300,400]ms p99 = [400,500]ms max = 43601.133ms mean = 121.346ms
INFO 2013-07-11 18:38:14,143 [main]: DELETE_LINK count = 2991228 p25 = [0.8,0.9]ms p50 = [5,6]ms p75 = [100,200]ms p95 = [200,300]ms p99 = [400,500]ms max = 28061.381ms mean = 84.484ms
INFO 2013-07-11 18:38:14,143 [main]: UPDATE_LINK count = 8015646 p25 = [4,5]ms p50 = [10,11]ms p75 = [100,200]ms p95 = [200,300]ms p99 = [400,500]ms max = 52727.882ms mean = 116.926ms
INFO 2013-07-11 18:38:14,143 [main]: COUNT_LINK count = 4884577 p25 = [0.4,0.5]ms p50 = [2,3]ms p75 = [100,200]ms p95 = [200,300]ms p99 = [300,400]ms max = 1237.999ms mean = 54.249ms
INFO 2013-07-11 18:38:14,143 [main]: MULTIGET_LINK count = 526444 p25 = [0.4,0.5]ms p50 = [1,2]ms p75 = [4,5]ms p95 = [100,200]ms p99 = [200,300]ms max = 1215.957ms mean = 28.999ms
INFO 2013-07-11 18:38:14,144 [main]: GET_LINKS_LIST count = 50695244 p25 = [0.6,0.7]ms p50 = [2,3]ms p75 = [82,83]ms p95 = [200,300]ms p99 = [300,400]ms max = 2971.475ms mean = 46.316ms
INFO 2013-07-11 18:38:14,147 [main]: REQUEST PHASE COMPLETED. 100000000 requests done in 26979 seconds. Requests/second = 3706
Why am I seeing such a slow performance from Percona 5.5 (approx 3X lower)? It is the same hardware and similar Innodb settings. Am I missing any important setting?
Hello am running linkbench with mysql server.My concern is am running the linkbench with different requests i.e 2500,500, 7500 and 10,000 by keeping the requestros constant to 70.
i need to check the CPU N MEMORY utilization when running these.
When i conduceted experminet by running requests with 2500 and 5000 % of CPU increases linearly.When i run it with 7500 and 10,000 % of CPU is decreasing…As the requests increses CPU also shud get increse linearly right…..Y it is happening so to me??? Could u please me…..
n am using fedora20 with 2 GB RAM n 500GB hard-disk