

One of our primary focuses at Percona is performance. Let me make some statements on what is “performance.”
In doing so I will refer to two pieces of content:
- Carry Millsap’s talk “Performance Instrumentation: Beyond What You Do Now” [1]
- White Paper (by Peter and Baron) “Goal-Driven Performance Optimization” [2]
I highly recommend that you familiarize yourself with both of them.
Performance
Performance is about tasks and time.
We say that the system is performing well if it executes a task in an acceptable period of time, or that the system executes the required amounts of tasks per given period (sec, minute, hour etc).
To put it in our area of interest, what is a task for a database? Often we consider this as an individual query, and this is good enough detalization. One may think about database task as a “transaction” or set of queries executed during web page access, but I propose we focus on queries.
From this prospective, the database (MySQL) shows good performance if it executes the query in a reasonable amount of time (this is what we know as Response Time), or executes the expected amount of queries per second (hour/day) (this is Throughput).
So we connected a query execution with performance.
And let me state this: most database performance problems are related to queries. Either there are too many queries to handle (the system is overloaded; we ask to perform more tasks then the system is able to handle); or a query takes a long time to execute (the system is not handling the task in optimal way). Of course there could be another reasons, like hardware failure, database misconfiguration, OS issues etc, but, again, in most cases it is Queries what is problem.
“Performance is HARD”
Now, in [1] Carry Millsap states that “Performance is HARD”, and it is true, if you do not know where to look.
Very often people look into some funny places like cache hit ratio (“You have only 93% cache hit ratio, that your problem!”), amount of IO per second, CPU utilization, aborted_clients, handler_select you name it. Looking at these numbers with some experience and black magic may give you some results, or may not. When you look at these numbers, make some conclusions, then make some changes in hope it helps – it is a performance tuning, not performance optimization [1].
Fortunately, Performance is EASY if you know what to look into [1].
With Percona Clould Tools we make Performance EASY – our tools show you what you should be looking for.
Right now we have one module: Query Analytics, which is focused on queries. Query Analytics is based on our command line tool pt-query-digest from Percona Toolkit and we implement our best practices in how we analyze queries working with customers systems. Peter actually names this tool “Peter in the box”.
Percona Cloud Tools / Query Analytics
Let me review what information Query Analytics provides…
1. General Query Profile
Which queries takes the most time in the database, and information on how many queries execute, total time they took, average time per query and 95% response time.
Let’s see an example for the MySQLPerformanceBlog.com for one week time frame. This blog is WordPress based, so the queries are coming from WordPress:
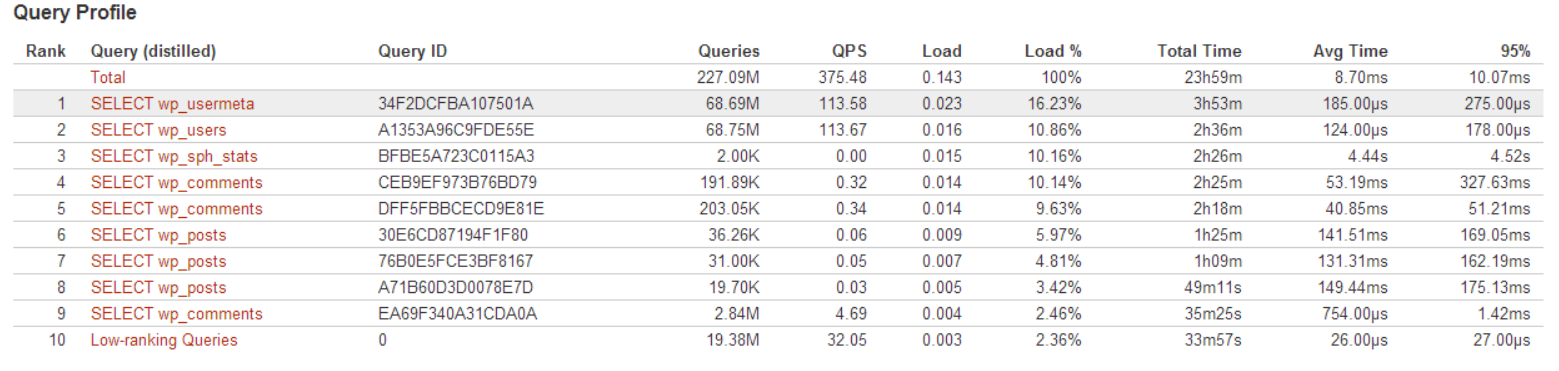
The two top queries are related to users:
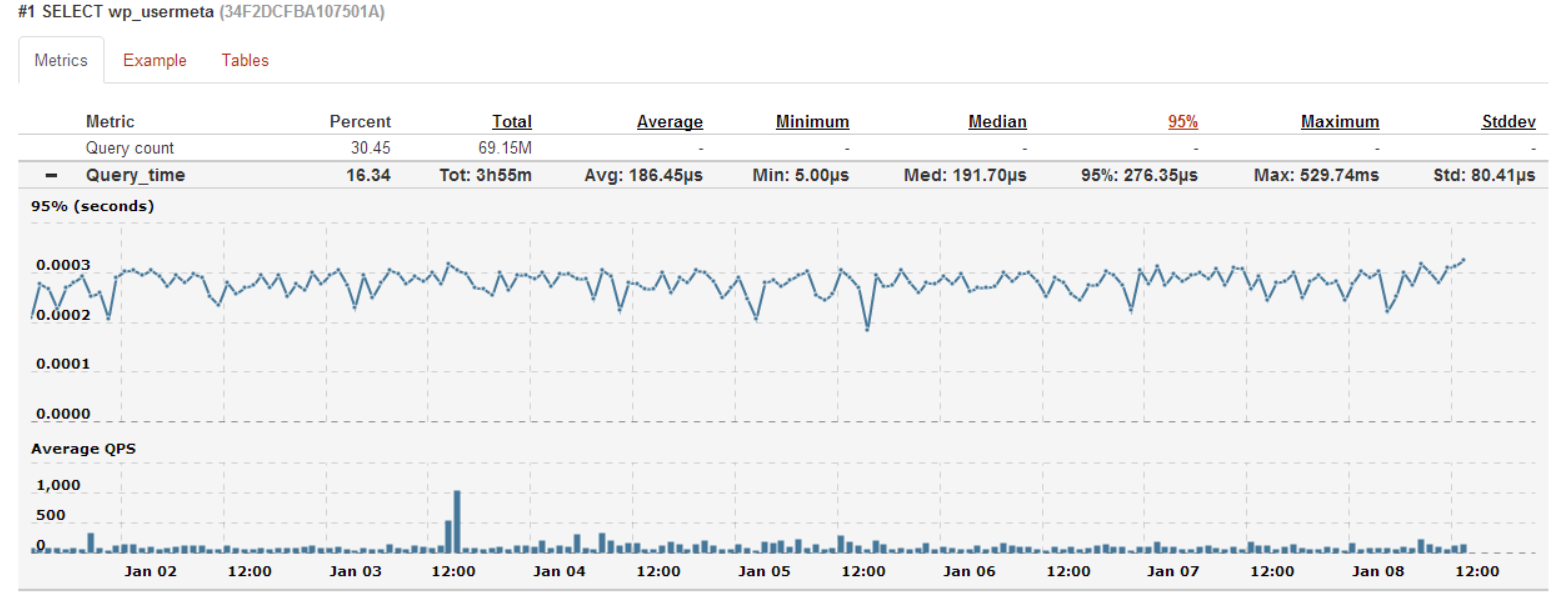
SELECT wp_usermeta and SELECT wp_users, and we can see that both of them are executed 69M times for the last week. Though 95% response time for first one is 277.00µs, which is just fine.
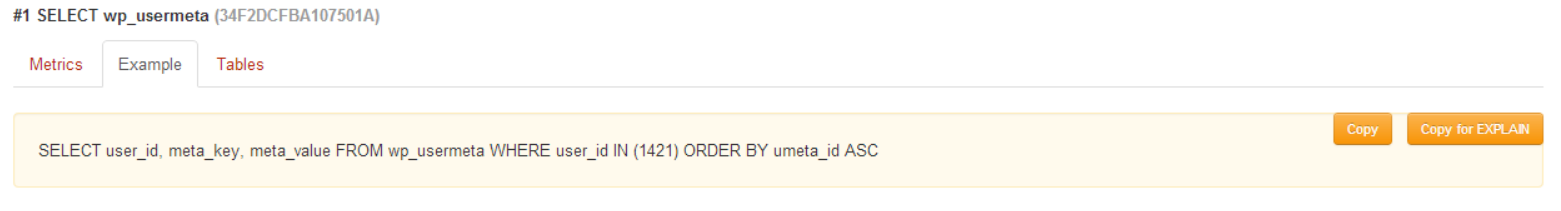
There we can click and see more details about query:
Query Text and
Metrics
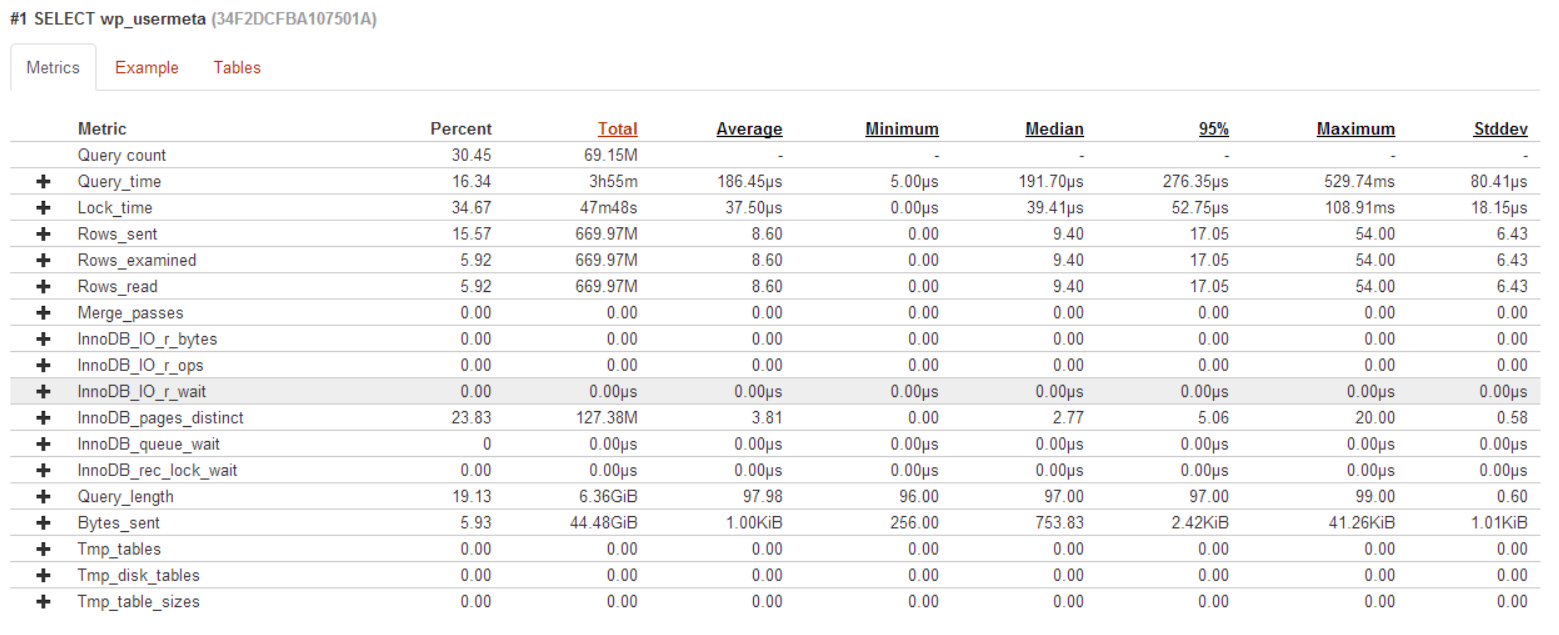
…which shows that execution time for the query was from (Min) 5.00µs to (Max) 529.74ms
Bunch of metrics like InnoDB* are available only of you are using Percona Server.
What is more interesting is that Query Analitycs allows us to see historical data.
If we switch to graph we can see the data for the last week:
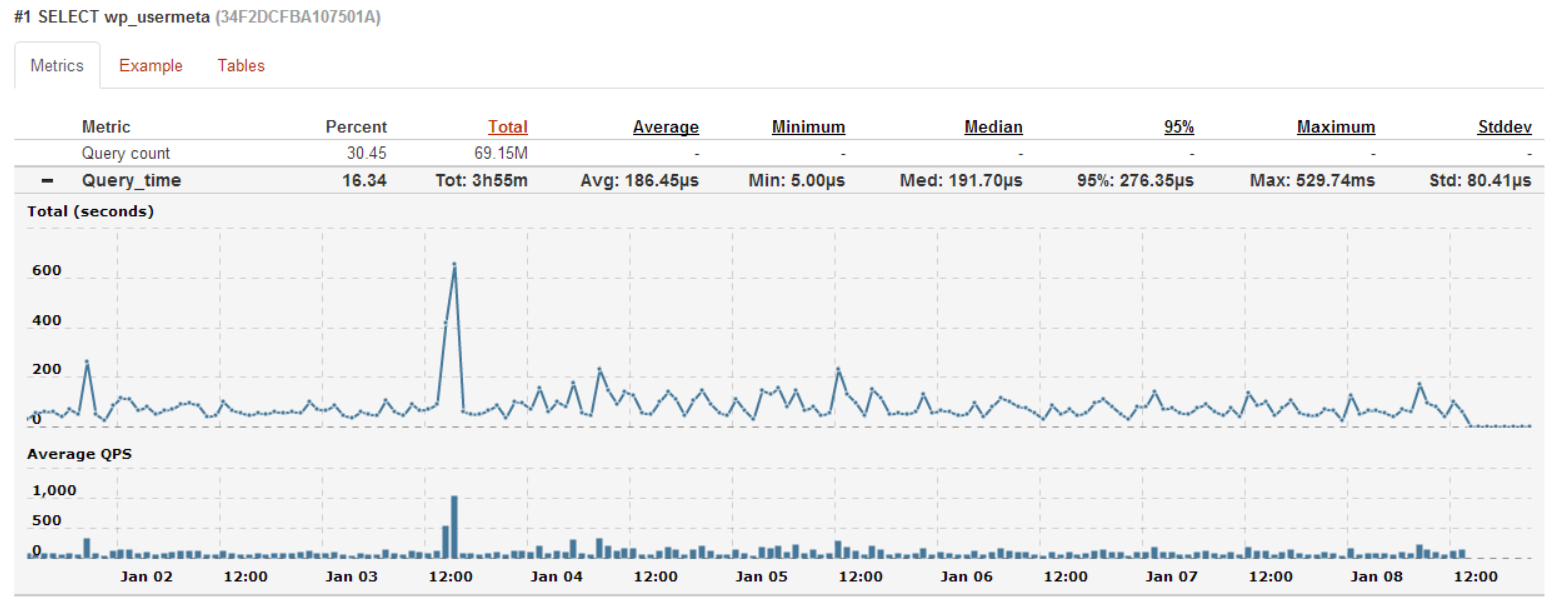
Where we clearly see a spike in amount of queries. This corresponds to the published post: Multiple column index vs multiple indexes with MySQL 5.6.
And there we can switch between Total and 95% graph,
…which shows that even with the spike, the 95% response time of this query was not affected and that means MySQL (Percona Server) was able to handle the load.
Query Analytics helps you:
- Be sure your queries (tasks) are performed as expected
- Queries are executed within the time frame you need
- If not, then you will be able to see which query (or several) are problematic and requires attention
- Get detailed metrics for each query
Percona Cloud Tools is to make MySQL Performance Easy!
You can (and should) sign up for free Beta and try the tool yourself.


Hi everybody,
I use Percona Cloud Tools for many weeks and I like this tool, bit today I have a problem with a node.
I have this error message :
“Can’t call method “info” on an undefined value at /usr/bin/pt-agent line 6862.”
Do you know what is the proble and how can I resolve.
Thx for your help
Aziz,
If it’s the same bug I recall, then it should be fixed in latest version, 2.2.6.
Hi Daniel,
Thx for your help but my version is percona-toolkit-2.2.6-1.
Hi,
My version percona-toolkit is 2.2.7-1 in three nodes.
I don’t understand what’s happen but it doesn’t work.
I can start or uninstall pt-agent.
What can Ido ?
Thx
Aziz
Aziz,
Sorry for the delay. Let’s use https://bugs.launchpad.net/percona-toolkit/+bug/1285357 to discuss and solve this bug.
is there any way to use cloud-tools with amazon rds? I couldn’t find any documentation on the issue and would love to give it a try!