

I recently helped a client implement a custom replication delay monitor and wanted to share the experience and discuss some of the iterations and decisions that were made. percona-millipede was developed in conjunction with Vimeo with the following high-level goal in mind: implement a millisecond level replication delay monitor and graph the results. Please visit http://making.vimeo.com for more information and thanks to Vimeo for sharing this tool!
Here is the rough list of iterations we worked through in developing this tool/process:
- Standard pt-heartbeat update/monitor
- Asynchronous, threaded update/monitor tool
- Synchronized (via zeroMQ), threaded version of the tool
pt-heartbeat
Initially, we had been running pt-heartbeat (with default interval of 1.0) to monitor real replication delay. This was fine for general alerting, but didn’t allow us to gain deeper insight into the running slaves. Even when pt-heartbeat says it is “0 seconds behind”, that can actually mean the slave is up to .99 seconds behind (which in SQL time, can be a lot). Given the sensitivity to replication delay and the high end infrastructure in place (Percona Server 5.6, 384G RAM, Virident and FusionIO PCI-Flash cards), we decided it was important to absorb the extra traffic in an effort gain further insight into the precise points of any slave lag.
There had been discussion about tweaking the use of pt-heartbeat (–interval = .01 with reduced skew) to look at the sub-second delay, but there were some other considerations:
- The tool needed to update/monitor multiple hosts from a single process (i.e. we didn’t want multiple pt-heartbeat processes to track)
- Native integration with existing statsd/graphite system
We likely could’ve achieved the above using pt-heartbeat, but it would’ve required a custom wrapper application to handle the other pieces (threads/subprocesses/inter-process communication). As the main gist of pt-heartbeat is fairly straightforward (select ts from heartbeat table, calculate delay), it was decided to mimic that logic in a custom application that was configurable and met the other goals.
First Iteration – Async update/monitor
The first iteration was to spin up several threads within a main process (I chose Python for this, but it could be anything really) and set each in a loop with a set delay (.01 seconds for example). One thread sends update statements with a timestamp, the other threads simply select that timestamp and calculate how long ago the row was updated (i.e. current time – row timestamp):
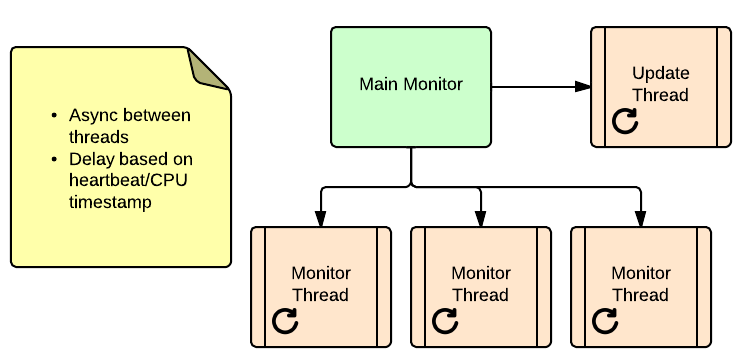
This iteration was better (we could see replication delay of 1-999 ms and isolate some sub-optimal processes), but there was still some concern. When testing the solution, we noticed that when pointing the monitor against a single box (for both the update and select), we were still seeing replication delay. After some discussion, it became apparent that using the current CPU time as the baseline was introducing time to calculate the delay as part of the delay. Further, since these threads weren’t synchronized, there was no way to determine how long after the update statement the select was even run.
Final Iteration – ZeroMQ update/monitor
Based on this analysis, we opted to tweak the process and use a broadcast model to keep the monitor threads in sync. For this, I chose to use ZeroMQ for the following reasons:
- Built in PUB/SUB model with filtering – allows for grouping masters with slaves
- Flexibility in terms of synchronization (across threads, processes, or servers – just a config tweak to the sockets)
After the update, here was the final architecture:
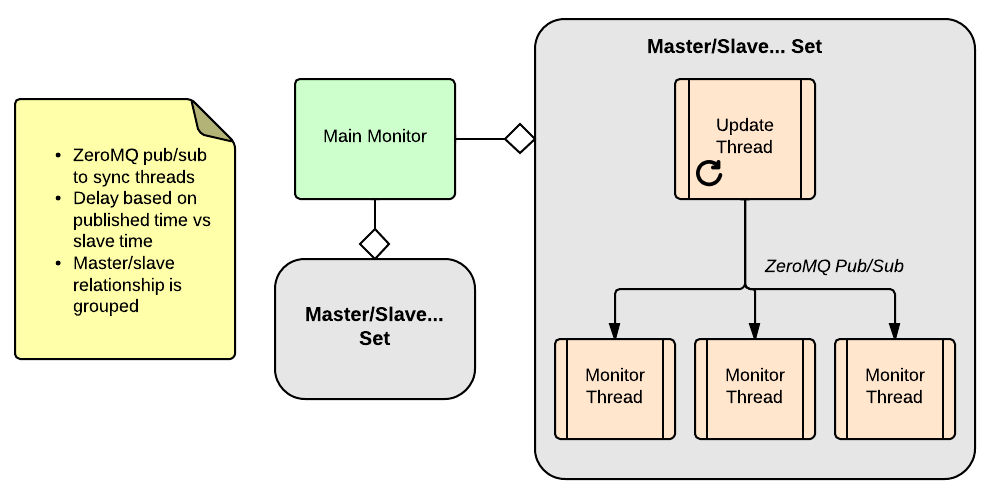
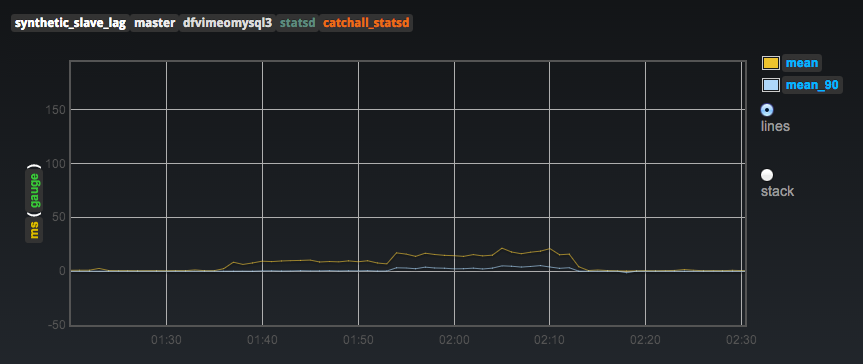
In this model, the update thread publishes the timestamp that was set on the master and each monitor thread simply waits as a consumer and then checks the timestamp on the slave vs the published timestamp. Synchronization is built in using this model and we saw much more accurate results. As opposed to sitting at 5-10ms all the time with spikes up to 50ms, we found 0ms in most cases (keep in mind that means 0ms from an application standpoint with network latency, time to process the query, etc) with spikes up to 40ms. Here is a sample graph (from Graph Explorer on top of statsd, courtesy of Vimeo) showing some micro spikes in delay that pointed us to a process that was now noticeable and able to be optimized:
While this process was what the client needed, there are some things that I’d like to point out about this approach that may not apply (or even hinder) other production workloads:
- The frequency of update/select statements added several hundred queries per second
- You could configure less frequent update/selects, but then you may see less accuracy
- The longer delay between updates, the less chance you will see delay
- For replication delay monitoring (i.e. Nagios), 1 second granularity is plenty
- Typically, you would only alert after several seconds of delay were noticed
Naturally, there are some other factors that can impact the delay/accuracy of this system (pub/sub time, time to issue select, etc), but for the purpose of isolating some sub-optimal processes at the millisecond level, this approach was extremely helpful.
Stay tuned for a followup post where I’ll share the tool and go over it’s installation, configuration, and other details!


